31 Jul Discharge Mixing Zone Mapping
We had a great week out in June mapping discharge mixing zones at six wastewater treatment plants.
Mapping was undertaken using a mix of on foot (i.e. water meter with GPS and data logger) and drone boat (Platypus Lutra).
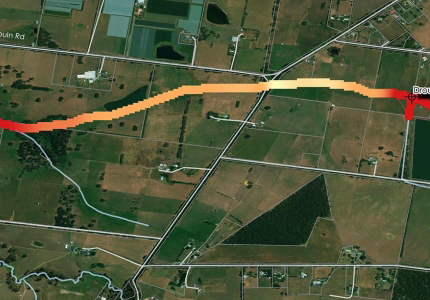
The first image is a map of nitrite (NO2) discharging to a small stream. The mapped distance is approximately 4km. You can see NO2 start to reduce until a large plume was mapped, likely from cattle/dairy wash-down into the stream. The mapping indicated that discharge NO2 wold have likely reduced to background levels by the end of the mapped mixing zone, and that there are other more significant NO2 inputs in the catchment.

This second image is a map of electrical conductivity (EC) on a large wetland and connected drain and river. The wetland was mapped using the drone and drain/river on foot. Discharge is supposed to enter the eastern corner of the wetland, working it way through the wetland and discharging into the drain at the northern tip. However, the mapping indicated that some discharge is bypassing the wetland, flowing straight down the drain into the river.

This final image is the Lutra drone being prepped for deployment. A very cool bit of kit!


No Comments